Introduction: Why Patterns Instead of Just Colors?
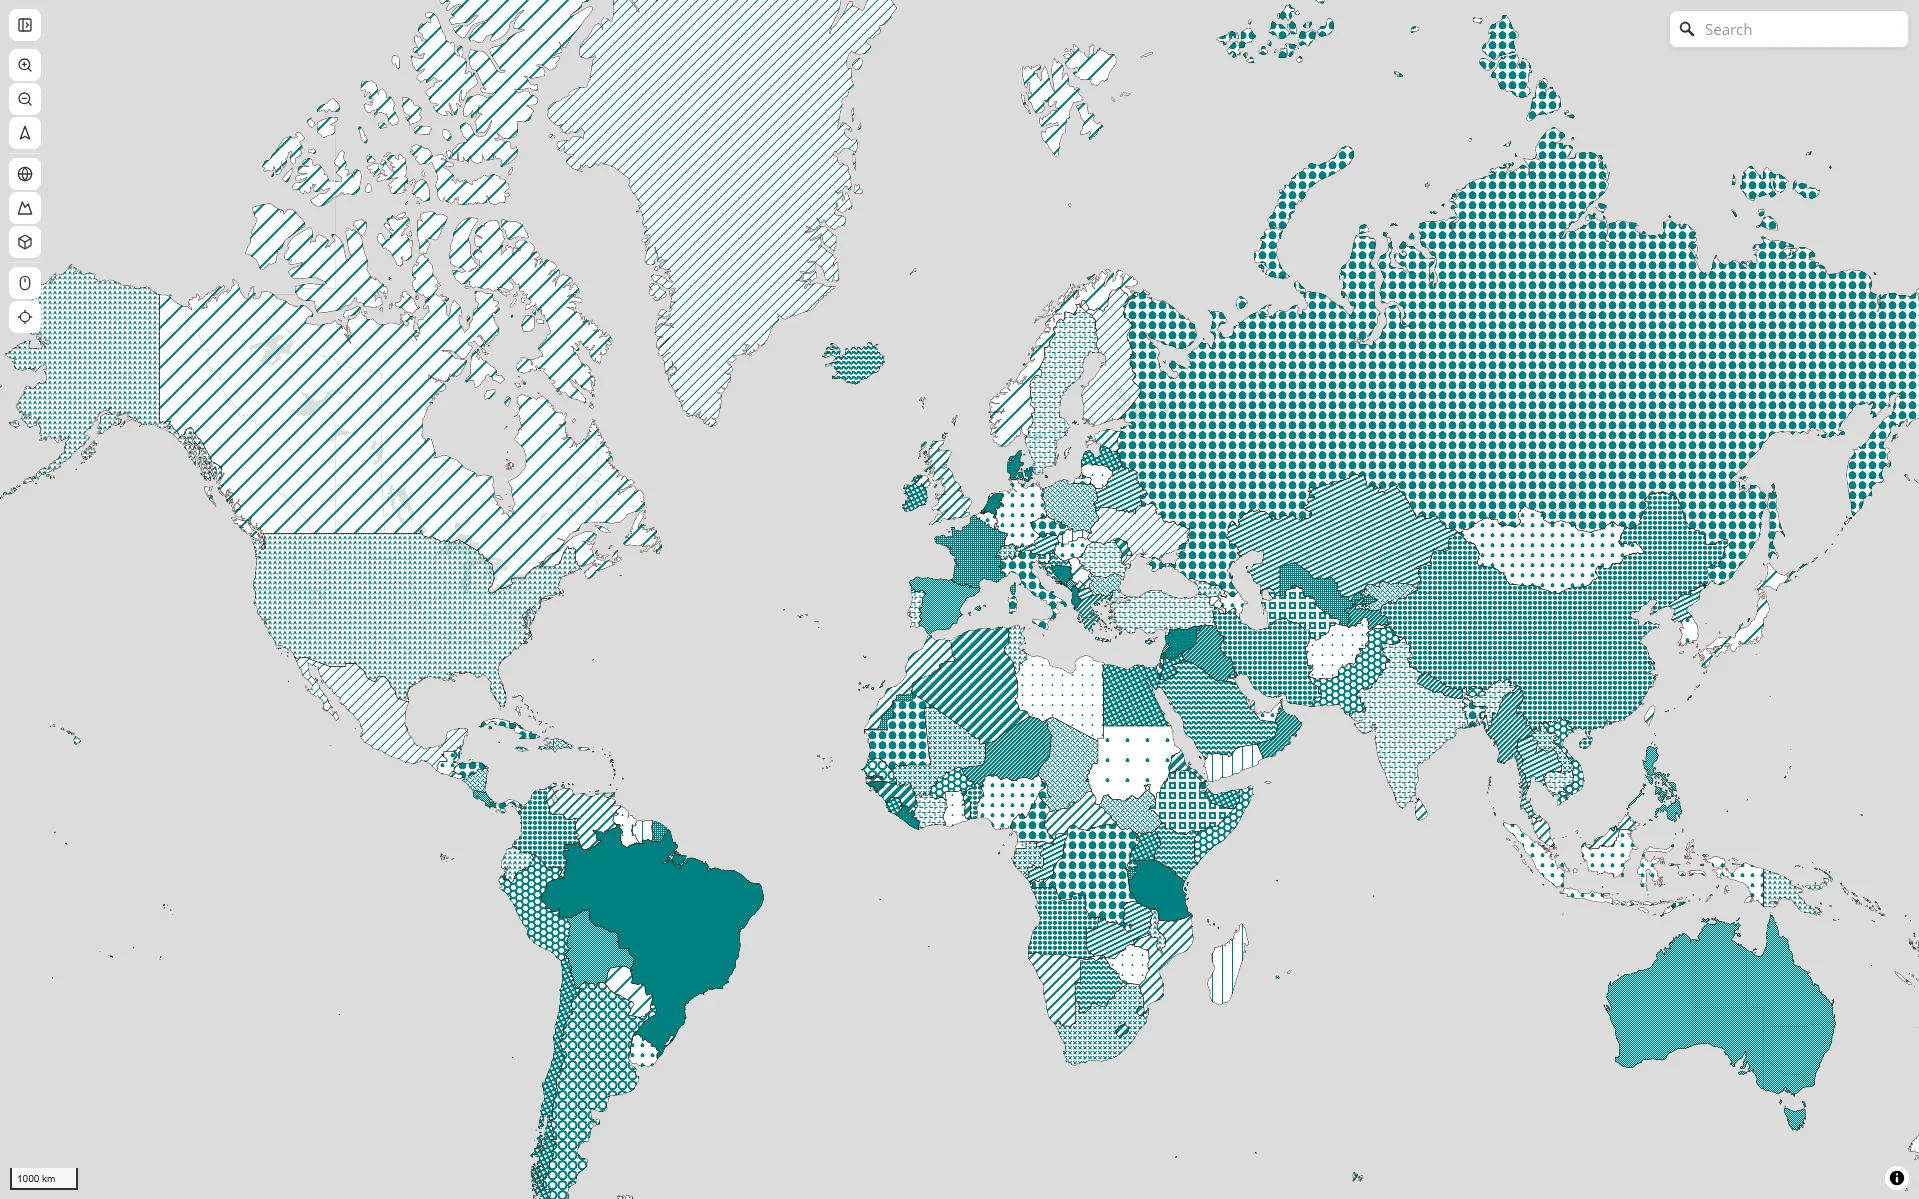
This article is about Geoglify.com, a map built with MapLibre GL JS. I’ll show how to generate, assign, and render SVG patterns across hundreds of polygon features so that adjacent regions never end up with the same pattern, and every texture stays crisp on Retina screens.
Most web maps use color alone to distinguish regions. But color has three fundamental limitations:
-
Accessibility. Around 8% of men have some form of color vision deficiency. Red-green distinctions vanish. Pastel palettes blend together. Patterns work for everyone, regardless of how they perceive color.
-
Print. Maps printed in grayscale lose all color-based distinctions. Patterns survive the transition to black and white.
-
Two-dimensional encoding. Solid fill encodes only one variable: color. Patterns add a second visual channel. In a thematic map, you can use color for one metric (population density) and pattern for another (administrative region). This is standard in classical cartography but rare on the web — and it opens up map readability in ways color alone cannot.
SVG patterns in particular have advantages over raster textures: they scale infinitely, stay crisp at any zoom level, and weigh almost nothing in terms of file size.
The challenge is that MapLibre’s WebGL renderer doesn’t accept SVG directly. Each pattern must be rendered to a hidden canvas at the exact pixel ratio of the screen, converted to bitmap, and registered with the map. Get the ratio wrong and the pattern looks blurry or misaligned on Retina displays. And there is one piece missing: ensuring adjacent regions never share the same pattern. That is graph coloring.
Architecture Overview: The Full Pipeline
Before diving into each component, here is how everything fits together:
flowchart TD
  subgraph PATTERN["Pattern Generation"]
      A["textures.js"] --> B["SVG"] --> C["Canvas"] --> D["map.addImage()"]
      D --> E["Pattern Cache (Map<key, Promise>)"]
  end
  subgraph ADJACENCY["Adjacency & Coloring"]
      F["collectPolygonFeatures()"] --> G["R-tree (rbush)"]
      G --> H["Edge Hashing"]
      H --> I["Adjacency Graph"]
      I --> J["Random Greedy Coloring"]
      J --> K["colorAssignments Map"]
  end
  subgraph RENDERING["Rendering"]
      L["setData()"] --> M["MapLibre reads fill-pattern expression"]
      M --> N["Pattern renders at correct pixel ratio"]
  end
  E --> L
  K --> L
Every piece in this pipeline solves a specific problem. The next sections walk through each one in the order they appear.
Problem 1: MapLibre’s WebGL Renderer Doesn’t Accept SVG
MapLibre renders everything through WebGL. WebGL textures are bitmaps — arrays of RGBA pixels. SVG is a vector format: instructions for drawing shapes. The two don’t talk to each other directly.
To bridge this gap, every SVG pattern must go through a conversion pipeline:
SVG string → Image object (via Blob URL) → Canvas 2D drawImage → ImageData → WebGL textureMapLibre provides map.addImage(name, imageData, options) specifically for this purpose. It accepts an ImageData object (or an HTMLCanvasElement or HTMLImageElement) and uploads it as a WebGL texture that can be referenced in a fill-pattern paint property.
The challenge is that this conversion happens at a fixed pixel size. If you generate a 10×10 pixel texture and the screen has a devicePixelRatio of 2, MapLibre stretches it to 20×20 CSS pixels — and it looks blurry.
But that is a problem for later. First, I need to generate the SVG patterns themselves.
Problem 2: Generating Patterns Programmatically with textures.js
textures.js is a tiny library (~5KB gzip) that generates SVG patterns programmatically: lines, circles, hexagons, waves, crosses, and more. Each pattern is a function that returns an SVG string when rendered with D3 selections.
import textures from 'textures';

const pattern = textures.lines()
  .size(10)
  .stroke('#E63946');
The patterns are lightweight SVG fragments: no external assets, no font dependencies, no images to load. Just paths and strokes. This makes them ideal for generating dozens of distinct textures on the fly.
But textures.js outputs SVG, not ImageData. To get the SVG into MapLibre, I render it onto an HTML Canvas:
const svg = document.createElementNS('http://www.w3.org/2000/svg', 'svg');
const sel = select(svg);
sel.call(textures.lines().size(10).stroke('#E63946'));

const canvas = document.createElement('canvas');
canvas.width = 10;
canvas.height = 10;
const ctx = canvas.getContext('2d');
// ... serialize SVG to Blob URL → Image → drawImage onto canvas ...
This works. But there is a catch: the size matters. Generate at 10×10 on a Retina display and the result is a blurry mess. Which brings us to the next problem.
Problem 3: Keeping Patterns Crisp on Retina Displays
The devicePixelRatio of a standard monitor is 1. On a Retina MacBook Pro it is 2. On some high-end Android devices it can be 3 or more.
If I generate a pattern at 10×10 pixels on a Retina screen, the browser draws it at 10×10 device pixels, which fill 20×20 CSS pixels. The result is a 1× texture stretched to 2× size — visibly blurry.
The fix is to generate the pattern at the full device pixel resolution and tell MapLibre about it:
async function generateAndRegisterPattern(map, patternId, color) {
  const ratio = window.devicePixelRatio || 1;

  // Scale the SVG and canvas by the pixel ratio
  const svg = document.createElementNS('http://www.w3.org/2000/svg', 'svg');
  svg.setAttribute('width', 10 * ratio);
  svg.setAttribute('height', 10 * ratio);

  const sel = select(svg);
  sel.call(textures.lines().size(10 * ratio).stroke(color));

  const canvas = document.createElement('canvas');
  canvas.width = 10 * ratio;
  canvas.height = 10 * ratio;
  const ctx = canvas.getContext('2d');
  // ... convert SVG to ImageData ...

  const name = `geoglify-pattern-${patternId}-${color}`;
  map.addImage(name, imageData, { pixelRatio: ratio });
}
The pixelRatio parameter is the key. When devicePixelRatio is 2, I generate the SVG at 20×20 pixels and pass { pixelRatio: 2 }. MapLibre then selects the correct mip level automatically based on the screen. A standard monitor uses the 1× version; a Retina display uses the 2× version. Both look sharp.
To avoid regenerating patterns on every color change or map interaction, I cache them:
const cache = new Map();

async function ensurePatternImage(map, patternId, color) {
  const key = `${patternId}-${color}`;
  if (cache.has(key)) return cache.get(key);

  const promise = generateAndRegisterPattern(map, patternId, color);
  cache.set(key, promise);
  return promise;
}
On the map layer, a MapLibre expression reads each feature’s geoglify:patternId and geoglify:patternColor from its properties and selects the correct image:
const fillPatternExpr = [
  'case',
  ['boolean', ['get', 'geoglify:patternEnabled'], false],
  ['concat', 'geoglify-pattern-',
    ['get', 'geoglify:patternId'], '-',
    ['get', 'geoglify:patternColor']],
  'geoglify-pattern-dummy',
];
With patterns rendering sharply on any screen, the hard part remains: ensuring adjacent countries never share the same pattern.
Problem 4: Ensuring Adjacent Regions Never Share the Same Pattern
I have 242 adjacent countries. Each one needs a pattern, and neighbors must never share the same one. The assignment must be computed fast enough that the UI never freezes. Before solving this, each country got a random SVG pattern — two neighbours would regularly end up with the same one.
This breaks down into three sub-problems: finding who is adjacent (without testing all 242 pairs), detecting exact shared borders (without expensive geometry math), and assigning 28 patterns to 242 countries with zero conflicts.
4A. Spatial Filtering with R-Trees
The first sub-problem: who is adjacent to whom? For 242 countries, testing every pair one by one would be roughly 29,000 comparisons. For a map with thousands of polygons, that number grows quadratically.
I avoid this with an R-tree, a data structure that organizes polygons by their bounding boxes — the smallest rectangle that contains all vertices of a polygon. If two bounding boxes don’t overlap, the polygons can’t possibly touch, so I skip them.
First, I calculate the bounding box for every polygon:
function calcBBox(coords) {
  let minX = Infinity, minY = Infinity;
  let maxX = -Infinity, maxY = -Infinity;
  for (const [x, y] of coords) {
    if (x < minX) minX = x;
    if (y < minY) minY = y;
    if (x > maxX) maxX = x;
    if (y > maxY) maxY = y;
  }
  return [minX, minY, maxX, maxY];
}
Then I load all 242 bounding boxes into the R-tree in one batch:
const tree = new RBush();
const items = polygons.map((p, i) => {
  const [minX, minY, maxX, maxY] = calcBBox(p.coordinates);
  return { minX, minY, maxX, maxY, i };
});
tree.load(items);
Now, to find potential neighbors for a given polygon, I query the R-tree with its own bounding box. The tree returns only the polygons that are spatially close:
const [minX, minY, maxX, maxY] = calcBBox(polygon.coordinates);
const candidates = tree.search({ minX, minY, maxX, maxY });
Each polygon tests only a handful of candidates instead of all 241 others. This is O(n log n) instead of O(n²): the difference between milliseconds and seconds as the map grows.
4B. Edge Hashing for Exact Adjacency Detection
The R-tree gives me candidate neighbors. But overlapping bounding boxes don’t guarantee a shared border — two countries could be on opposite sides of a river. I need exact adjacency detection, fast.
For this I use edge hashing. Every polygon is made of edges: straight lines between consecutive vertices. Two countries share a border if they share at least one edge. Instead of running expensive geometry intersection algorithms, I convert each edge into a text fingerprint.
function normalizeEdge(x1, y1, x2, y2) {
  return x1 < x2 || (x1 === x2 && y1 < y2)
    ? [x1, y1, x2, y2]
    : [x2, y2, x1, y1];
}

function edgeKey(x1, y1, x2, y2) {
  const [ax, ay, bx, by] = normalizeEdge(x1, y1, x2, y2);
  return `${ax.toFixed(6)},${ay.toFixed(6)}|${bx.toFixed(6)},${by.toFixed(6)}`;
}
Each edge becomes a string like -73.935242,40.730610|-73.935242,40.740610. I store all edge fingerprints of a polygon in a JavaScript Set. Checking whether two countries share a border becomes a single Set lookup:
function sharesEdge(edgesA, edgesB) {
  const [small, large] = edgesA.size <= edgesB.size
    ? [edgesA, edgesB] : [edgesB, edgesA];
  for (const key of small) {
    if (large.has(key)) return true;
  }
  return false;
}
This is O(1) per edge: no loops over every vertex, no geometry math, no Turf.js. Just string comparisons.
A quick note on floating-point noise. In JavaScript, 0.1 + 0.2 does not equal 0.3 due to IEEE 754 floating-point representation. The same problem appears in geospatial data: two datasets might store the same border point as 40.7306100000001 and 40.7306099999999. The .toFixed(6) call rounds each coordinate to six decimal places (~10cm precision), normalizing both values to the same string. Without this rounding, two identical borders would produce different hashes and the algorithm would miss the adjacency.
4C. Graph Coloring with a Random Greedy Algorithm
Now I have an adjacency graph: a list of neighbors for each polygon. The next step is assigning patterns, which is a classic graph coloring problem.
In graph theory, the Four Color Theorem states that any planar map can be colored with just four colors so that no adjacent regions share the same color. But “just four colors” means four solid fills. For patterns, I want variety — 28 distinct textures distributed evenly so the map is visually rich and each region is instantly identifiable by its pattern.
I use a greedy randomized approach:
const colors = new Int32Array(n).fill(-1);

for (let i = 0; i < n; i++) {
  let usedMask = 0;
  for (const neighbor of adj[i]) {
    const c = colors[neighbor];
    if (c >= 0) usedMask |= 1 << c;
  }

  const available = [];
  for (let c = 0; c < k; c++) {
    if (!(usedMask & (1 << c))) available.push(c);
  }

  colors[i] = available.length > 0
    ? available[Math.random() * available.length | 0]
    : Math.random() * k | 0;
}
Bitmasks make the neighbor check extremely fast. Instead of maintaining an array of used colors and calling .includes() or .indexOf() (which requires iteration), I store used patterns in a 32-bit integer — usedMask. Each bit position c represents pattern c. Setting a bit with usedMask |= 1 << c is a single CPU instruction. Checking if a pattern is used with usedMask & (1 << c) is another single instruction. This keeps the inner loop tight and the total runtime under 5ms for 242 countries.
The key difference from a classic greedy algorithm: instead of always picking the first available pattern (index 0, then 1, then 2…), I pick randomly among all available ones. This spreads the assignment evenly across all available patterns.
With classic greedy, the first five patterns get nearly all the work while the rest sit unused. With random selection, each pattern is assigned to roughly 8-9 countries, regardless of how many neighbors they have.
The results: 324 adjacent pairs detected, zero conflicts, 28 of 30 available patterns used with nearly uniform distribution.
Conclusion & Performance
The entire implementation (pattern assignment, adjacency detection, Retina handling) fits in about 200 lines of JavaScript. No Three.js, no WebGL shaders, no Turf.js. Just the browser’s Canvas 2D API, an R-tree, and a greedy algorithm.
| Operation | Naive approach | Optimized |
|---|---|---|
| Finding neighbors (242 countries) | ~29,000 brute-force tests | ~324 R-tree filtered tests |
| Full coloring runtime | No algorithm (was random) | ~5ms |
| Pattern registration (28 patterns) | Regenerated on every color change | Cached, instant on repeat calls |
| Retina screens | Blurry 1× texture scaled up | Sharp 2× SVG, pixelRatio-aware |
| Bundle size | Turf.js alone: ~200KB | textures.js: ~5KB + rbush: ~3KB |
Three design decisions make the algorithm fast:
-
R-tree spatial index prunes the search space from O(n²) to O(n log n). No unnecessary comparisons.
-
Edge hashing replaces geometry intersection with Set lookups. Checking if two polygons share a border costs the same as looking up a dictionary entry.
-
Random greedy assignment with bitmasks distributes patterns evenly with zero conflicts. No backtracking, no constraint solver — just one pass through the polygons with single-instruction neighbor checks.
And two decisions make the output sharp on every screen:
-
SVG textures from textures.js scale infinitely. Unlike bitmap patterns, they do not pixelate.
-
pixelRatio-aware registration serves the right resolution to each display. Retina gets 2×, standard gets 1×, MapLibre picks automatically.
The full implementation is in the Geoglify codebase and live at geoglify.com. Import any GeoJSON with adjacent polygons, enable patterns, and see the assignment happen in real time.